Burning Man turned 21 this year… and it seems like it was just yesterday the Man was asking for the car keys.
Looking back over the years, Burning Man made it through its uncertain infancy, then its awkward adolescence, hitting puberty in the transitional years (let’s not forget that run-in with near disaster in 1996) before coming of age in those wild and wooly teenage years, and finding its place in the world, and on the map. In the last few years, we’ve seen the event and the culture mature, becoming more sure of itself, as we participants become more interested how our Burning Man experience applies to the world outside our front yard, and the world in turn becomes more aware of us.
In 2006, Burning Man reached adulthood. As evidenced by the year’s art theme “Hope and Fear: The Future”, the Man faced outward to the world, acknowledging its place in time, history, and world culture. No longer were we considering only what was before us in the immediacy of our experience, we were contemplating that experience in the larger frame of history, and our place in it. Often criticized for our “navel gazing” event and themes, this year’s theme boldly took on the world beyond the trash fence.
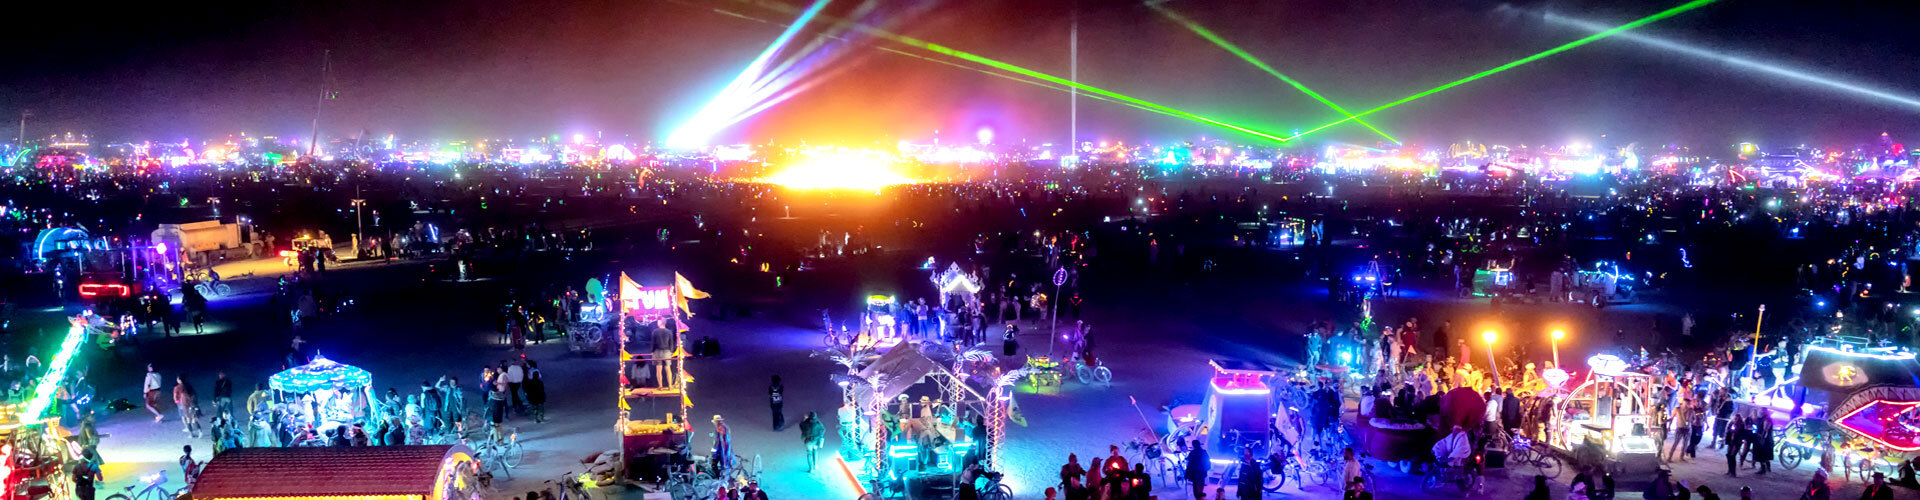
On playa this year, nearly 40,000 participants joined in the grand celebration of Burning Man and all it represents. As our city continues to grow, the infrastructure required to support it grows as well, and the DPW rose to the occasion once more to create, manage and dismantle Black Rock City – before it disappeared without a trace.
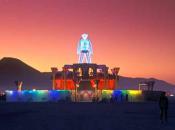
The Burning Man stood atop an Art Deco pavilion chock full of artworks and interactive installations. The Man Team ambitiously constructed a fully operational elevator, which allowed the Man to rise and fall in the evenings (allegedly) according to the tallied votes cast by participants about whether they felt hopeful or fearful about the future.
After the 2005 event, we honestly wondered how the art in 2006 could ever compare, let alone eclipse, the incredible artistic outpouring we saw in 2005. And then, our participants surprised us once again. As if responding to a gauntlet being thrown down, the artist community took on some incredible challenges.
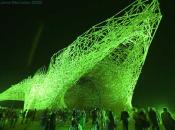
This trend was led by the independently-funded Belgian project officially titled “Uchronia (Message From the Future)”, but more commonly (and fondly) known as “The Belgian Waffle”… an outstanding structure of 2″x3” lumber that looked like a massive game of pick-up sticks suddenly formed a modernist cathedral. Its massive size and ornate construction simply overwhelmed the outer playa, and awed participants.
On the inner-playa, The Flaming Lotus Girls took their work to an all-new level of complexity and beauty, with the Serpent Mother, a stunning articulated flaming snake made of brushed steel and miles of electrical wire and gas plumbing. She would guard her copper egg with her robotic head and flaming teeth. This project was a stunning example of community-gathering artwork, just as previous FLG projects had been.
The Artery placed a record total of 300 art installations on playa, 240 of which had been pre-registered. The Burning Man Project awarded an impressive $425,000 worth of grants, divided amongst 40 separate art projects, assisting them with their journey to completion, and onto the playa for our community to enjoy.
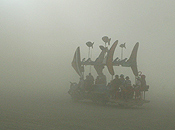
The weather was beautiful throughout the week, and the playa was generous enough to remind us of its power by throwing a surprise dust storm through the heart of the city, sending carports flying, and sandblasted participants scattering for cover. Love them or hate them, it just wouldn’t be Burning Man without a vicious dust storm to keep us honest.
Through the year prior to the event, the well-oiled machine of the Burning Man Project worked seamlessly to take on the ambitious operations of creating the event itself. As outstandingly complex as they are, the Burning Man staff and volunteers have dialed them in nearly to the point that their execution is practically an afterthought.
Teams who once struggled to find their way spent time this year fine-tuning well-heeled processes, bumping them up to the next level. If this year’s Afterburn Report seems somewhat banal, that is actually true testament to the high-quality execution of this organization. We do encourage you to read about the activities of our Administration Team, Communications Team, Playa Safety Team, Technical and Community Service Departments, to get a sense of the tremendous efforts these teams make look easy.
While many organizations in the same situation may rest on their laurels, and find ways to rake in more profits, Burning Man used this opportunity in a very different way. Given that Burning Man is run by a group of what are essentially highly-talented, passionate socio-cultural activists, it’s little surprise that they would focus on ways to take the core Burning Man Principles off playa, and apply them to the outside world.
After the 2005 event, a group of Burners headed to the Hurricane Katrina disaster area to help with the recovery and reconstruction process. Burners Without Borders was born. During 2006, this organization took on not only Katrina relief, but also instituted simultaneous multi-city beach clean-up projects, and a lumber recycling program on playa that resulted in the single-largest donation of building lumber that Reno’s Habitat for Humanity had ever seen.
The Burning Man Project focused many of its off-season hours and resources on development of the Regionals Network, whose ranks grew by 15 to bring our end-of-year total to 101 regional representatives in 72 locations around the world. In fact, our new Regionals Coordinator worked her way through a list of 50 individuals applying to become official regional contacts.
With all the year-round activities and events happening in the Burning Man community, the Burning Man event itself has organically transformed into a sort of Mecca… a once-a-year touchstone for the devoted to come and refresh their emotional coffers, so that they may take them back home to their communities, and sow the seeds of change in ways small and large. It is the Burning Man Project’s intention to directly and indirectly foster these off-playa activities by allocating our resources, time, money, advice and support to help make them successful. This includes, though not by any means is it limited to, The Black Rock Arts Foundation, Burners Without Borders, and the Regionals Network. Learn more in our Future Vision report.
Submitted by,
Will Chase